
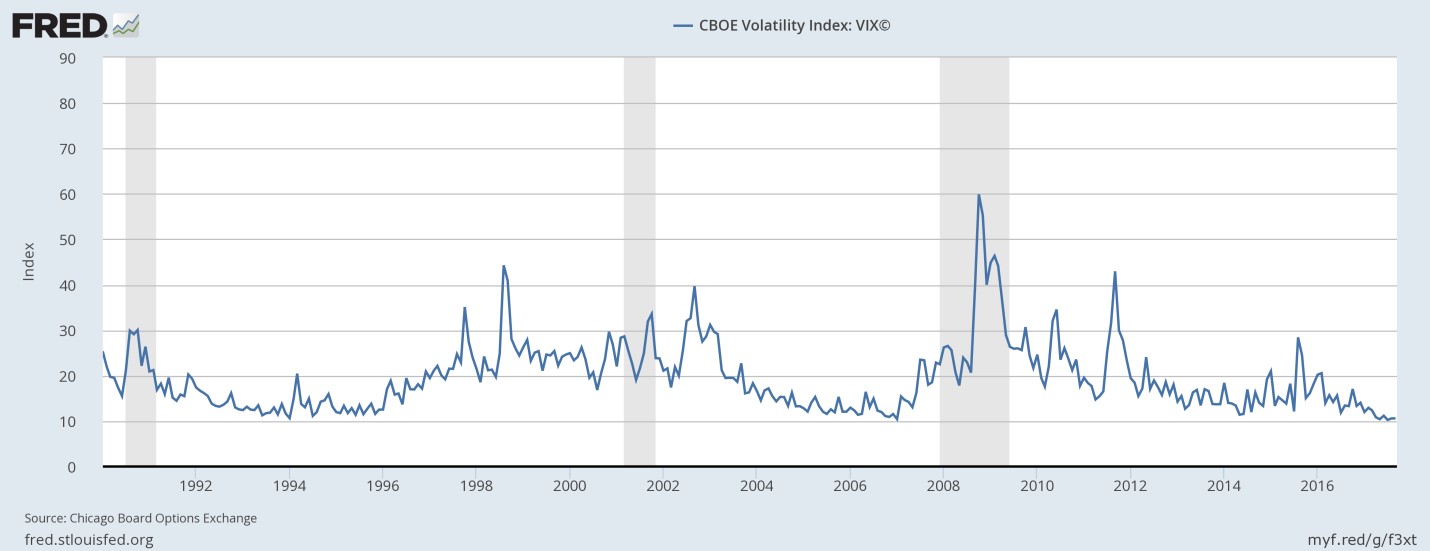
September 30, 2017 — During most of this year, the VIX — the Volatility Index on The Chicago Board Options Exchange — has been at the lowest levels of the last ten years. It recently dipped below 9, even lower than March 2007, just before the sub-prime mortgage crisis. It looks as though, once again, investors do not sufficiently appreciate how risky the world is today.
Known colloquially as the “fear index,” the VIX measures financial markets’ sensitivity to uncertainty, in the form of the perceived probability of large changes in the stock market. It is inferred from the prices of option on the stock exchange (which pay off only when stock prices rise or fall a lot). The low VIX in 2017 signals that we are in another “risk on” environment, when investors move out of treasury bills and other safe haven assets and instead “reach for yield” by moving into riskier assets like stocks, corporate bonds, real estate, and carry-trade currencies.
Figure 1: The VIX is at its lowest since 2007
One need not rely exclusively on the VIX to see that the markets are treating the current period more as a risk-on opportunity than risk-off. The returns on safe-haven assets were generally lower than the returns among risk-on assets in the first half of the year. On the one hand, the Swiss franc depreciated. On the other hand, the Australian dollar and Chinese yuan appreciated. And the stock market has hit record highs.
True risk is currently high
Why do I presume to second-guess the judgment of the VIX that true risk is low? One can think of an unusually long list of major possible risks. Each of them individually may have a low probability of happening in a given month, but cumulatively they imply a worrisome probability that at least one will happen sometime over the next few years:
* Bursting of stock market bubble. Major stock market indices hit new record highs this month (September 12), both in the United States and worldwide. Equity prices are even elevated relative to such benchmarks as earnings or dividends. Robert Shiller’s Cyclically Adjusted Price Earnings ratio is now above 30. The only times it has been this high were the peaks of 1929 and 2000, both of which were followed by stock market crashes.
Figure 2: Shiller’s adjusted P/E shows stocks at their 3rd-highest valuations since 1880.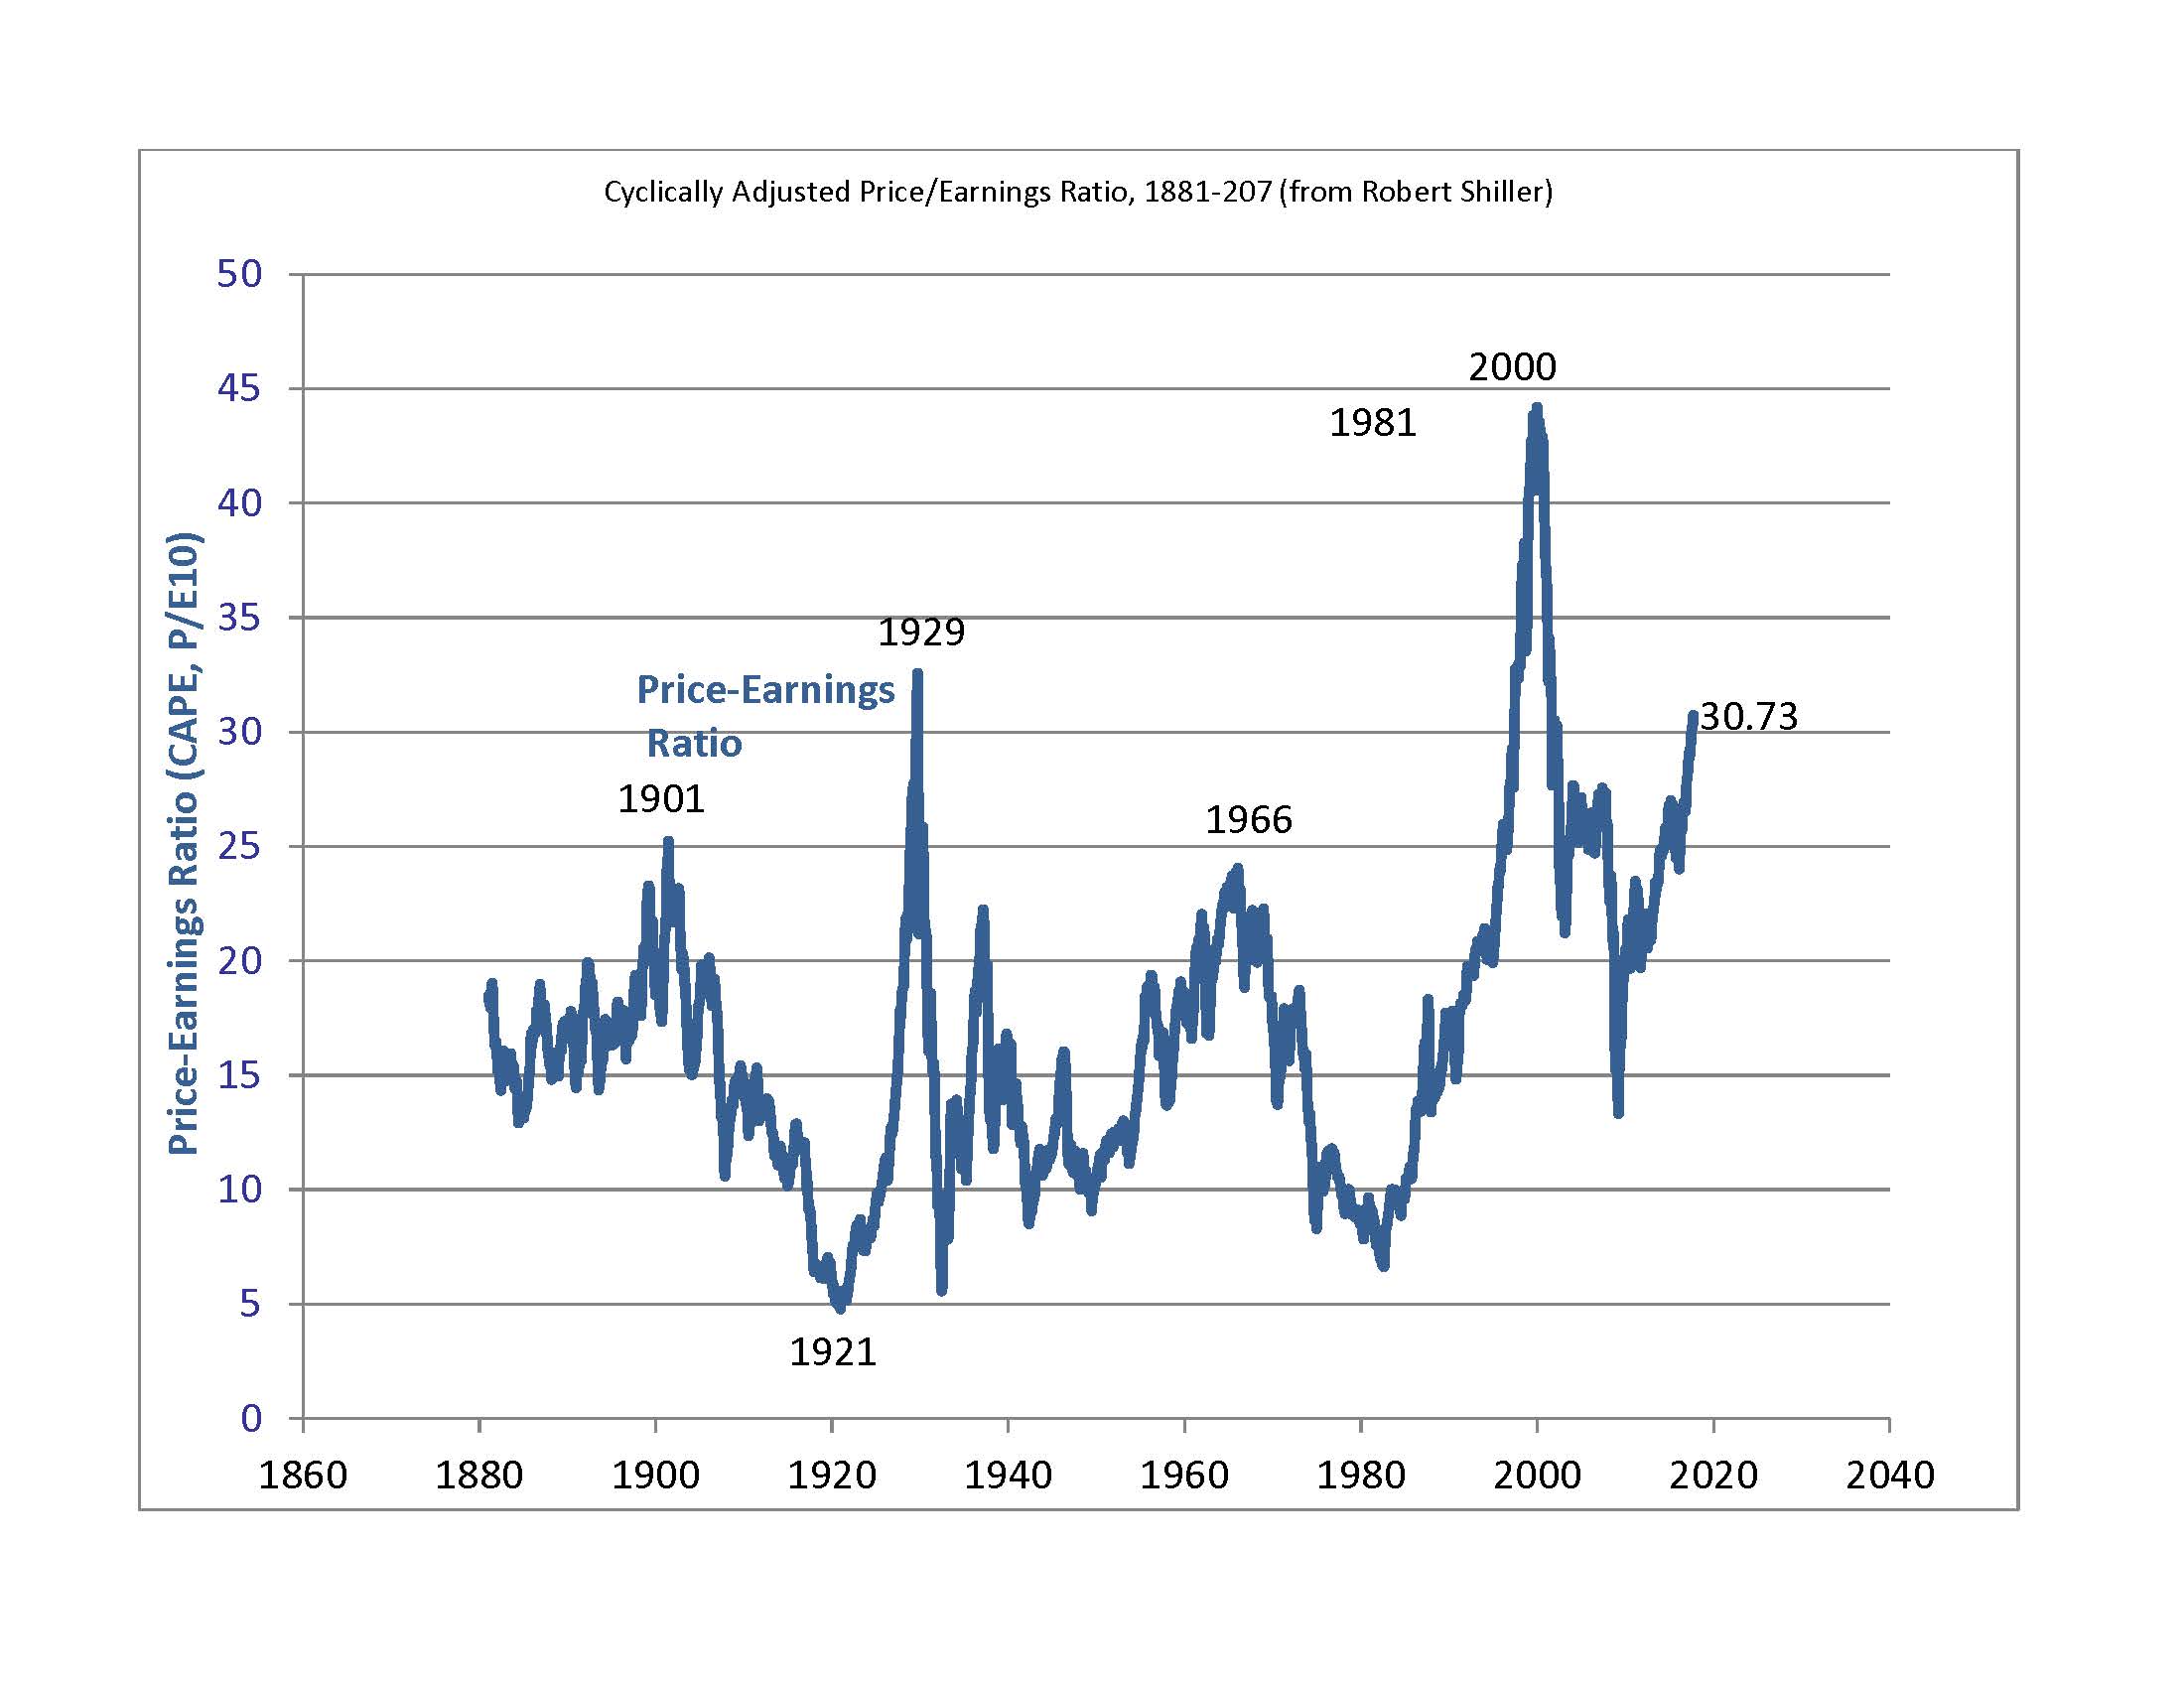
* Bursting of bond market bubble. Alan Greenspan has suggested recently that the bond market is even more overvalued (by “irrational exuberance”) than the stock market. After all, yields on corporate or government bonds were on a downward trend from 1981 to 2016 and the market has grown accustomed to it. But, of course, interest rates can’t go much lower and it is to be expected that they will eventually rise.
* What might be the catalyst to precipitate a crash in the stock market or bond market? One possible trigger could be an increase in inflation, causing an anticipation that the Fed will raise interest rates more aggressively than previously thought. The ECB and other major central banks also appear to be entering a tightening cycle.
* Geopolitical risks have rarely been higher, and faith in the stabilizing influence of America’s global leadership has rarely been lower. The gravest risk lies in relations with North Korea, which Trump’s response has been exceedingly erratic. But there are also substantial risks in the Mideast and elsewhere. For example Trump threatens to abrogate the agreement with the Iranians that is keeping them from building nuclear weapons.
* In many policy areas it is hard to predict what Trump will say or do next, but easy to predict that it will be something unprecedented. So far, the ill effects on the ground have been limited, in large part because most of the wild swings in rhetoric have not translated into corresponding legislation. (If he really had stuck with his decision to kick 800,000 young DACA workers and students out of the country it could have caused a recession.) But this is a time of policy uncertainty if there ever was one.
* US Congressional showdowns over the debt ceiling and government shutdown were successfully avoided in September, but only by kicking the can down the road to the end of the year, when the stakes could well be higher and the stalemate worse.
* A constitutional crisis could arise, if for example Special Counsel Robert Mueller were to find that contact between the Trump campaign and the Russian government was illegal.
Black swans are not unforecastable
The current risk-on situation is reminiscent of 2006 and early 2007, the last time the VIX was so low. Then too it wasn’t hard to draw up a list of possible sources of crises. One of the obvious risks on the list was a fall in housing prices in the US and UK, given that they were at record highs and were also very high relative to benchmarks such as rent. And yet the markets acted as if risk was low, driving the VIX and US treasury bill rates down, and stocks, junk bonds, and EM securities up.
When the housing market indeed crashed, it was declared an event that lay outside any standard probability distribution that could have been estimated from past data, supposedly an example of what was variously declared to be Knightian uncertainty, radical uncertainty, unknown unknowns, fat tails, or black swans. After all, “housing prices had never fallen in nominal terms,” by which was meant they had not fallen in the US in the last 70 years. But they had fallen in Japan in the 1990s and in the US in the 1930s. This was not Knightian uncertainty, but classical uncertainty with the data set unnecessarily limited to a few decades of purely domestic data.
In fact the “black swan” analogy fits better than those who use the term realize. Nineteenth-century British philosophers cited black swans as the quintessential example of something whose existence could not be inferred by inductive reasoning from observed data. But that was because they did not consider data from enough countries or centuries. (The black swan is an Australian species that in fact had been identified by ornithologists in the 18th century.) If I had my way, “black swan” would be used only to denote a tail-event that could have been assigned a positive probability ex ante, by any statistician who took the care to cast the data net widely enough, but that is declared “unpredictable” ex post by those who did not have a sufficiently broad perspective to do so.
The risk-on risk-off cycle
Why do investors periodically under-estimate risk? There are specific mechanisms that capture how market analysts fail to cast the net widely enough. The formulas for pricing options require a statistical estimate of the variance. The formula for pricing mortgage-backed securities requires a statistical estimate of the frequency distribution of defaults. In practice, analysts estimate these parameters by plugging in the last few years of data, instead of going back to previous decades, say the 1930s, or looking at other countries, say Japan. More generally, there is a cycle described by Minsky whereby a period of low volatility lulls investors into a false sense of security which in turn leads them to become over-leveraged, leading ultimately to the crash.
Perhaps investors will re-evaluate the risks in the current environment, and the VIX will adjust. If history is a guide, this will not happen until the negative shock – whatever it is – actually hits and securities markets fall from their heights.
[A shorter version of this post appeared at Project Syndicate. Comments can be posted there or at Econbrowser.]