
July 25, 2021 — Ever since the 1960s, we have heard the cliché, “If they can put a man on the Moon, why can’t they do X?” where X is usually some goal like eliminating hunger — technologically simpler than the scientific miracle of space flight, but harder to accomplish in practice because it involves human behavior. In 2021, the salient question is, “If we can accomplish the scientific miracle of developing vaccines capable of ending the Covid-19 pandemic that has killed millions, why can’t we convince enough people to get vaccinated?”
In lower-income countries, jabs are often limited by the availability of vaccines. But this is not the case with countries as fortunate as the United States, where the problem is primarily vaccine hesitancy or even outright vaccine hostility.
Two Americas of perceptions
Many of us think it is crystal clear that the advantages of getting vaccinated far outweigh the disadvantages – not just for society as a whole, but also for the individual. So, selfishness can’t explain those who don’t do it. What explains the mystery of widespread vaccine hesitancy? [Personally, I have not had the opportunity to discuss this with anyone in that category.] In the words of Dr. Anthony Fauci, there are two Americas. Their perceptions regarding vaccination are separated by a wall.
We are informed that those in the other America are seldom persuaded by appeals to the expertise of remote authorities or by the logic of scientific methods, such as the Food and Drug Administration’s trials and approval of three vaccines to respond to the covid-19 emergency. That is, Moderna, Pfizer and Johnson & Johnson. (AstraZeneca was found among the British population to have proven equally effective.)
The skeptics require evidence that is more tangible, closer to home.
The negative correlation between vaccination and virus victims
Recent data across US counties show a strong negative correlation between vaccination rates and rates of infection, hospitalization, or death. In the week ending June 22, counties, where 30 % or fewer residents had been vaccinated, suffered 5.6 covid deaths per 100,000, while counties in which more than 60 % of residents had been vaccinated experienced less than half the deaths, only 2.1 per 100,000. This seems like evidence that is perhaps tangible and closer to home than FDA trials.
The criterion for the cause of death in all these studies is whether the doctor or coroner enters covid-19 on the death certificate. This probably understates the true number of deaths caused by covid-19, as International studies of excess mortality rates strongly suggest.
On updated data, a 1 percentage-point increase in a county’s percentage of adults (and teenagers) who were fully vaccinated as of June 9th was associated with a covid-19 death rate over the subsequent 30 days (to July 9th) that was lower by a highly significant .06 per 100,000 inhabitants. That represents 2% of the total monthly deaths related to covid. Extrapolating, the apparent statistical effect of going from the current average vaccination rate to 100% vaccination would be to bring covid-related deaths close to 0.
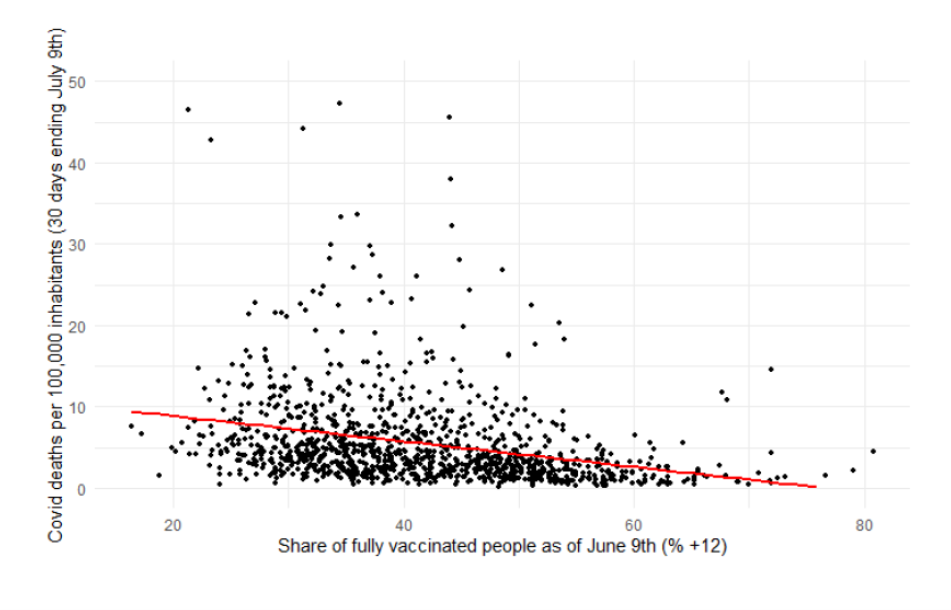
Figure 1: County-level covid-related deaths are negatively correlated with vaccination rates a month earlier (showing counties that reported at least one covid-death in the period). Source: Figure 2 in Frankel (2021).
But, as they say, correlation need not prove causality.
Perhaps the apparent beneficial effect of vaccination is really the illusory result of some third factor, such as the county’s poverty rate (an omitted variable). That is, perhaps low-income people are more likely to live in crowded conditions and for that reason to become covid victims, while at the same time they are less likely to get vaccinated. The beauty of econometrics is that one can control for third factors such as the poverty rate or local temperature, to isolate statistically the effect of vaccination rates.
Or perhaps the simple observed correlation between vaccination and the death rate understates the true effect of the former on the latter because of the endogeneity of vaccination: In a place where the coronavirus is a greater danger (say, because it is close to a major airport or another transport hub), people are more likely to see their neighbors falling victim to the virus and to react by deciding to get vaccinated themselves. This “reverse causality” could work toward an apparent positive correlation between vaccination and death rates.
This might help explain why earlier studies, conducted as recently as the beginning of June, did not find a clear negative correlation. Only recently has the beneficial effect of vaccination been powerful enough to dominate the statistical correlation in county data. The reason is probably the rising challenge of the Delta variant to the health of the unvaccinated.
Establishing the causal link from voting to vaccination to virus
The way to disentangle the causality is to examine the effects of variation in vaccination rates that is due not to variation in the spread of the disease, but rather to some unrelated factor (an exogenous instrument). Party affiliation or voting patterns are an obvious choice. Even before the vaccines, red–state governors in 2020 were found less likely to take steps such as mask mandates to fight the coronavirus.
As has been extensively reported, Republicans and those who voted for Donald Trump in the 2020 presidential election have been less likely to get vaccinated. Republicans are less likely than Democrats to accept vaccination by 45% versus 73%. An April 17 New York Times article found that the vaccination rate fell below 25% in counties where Trump won by a margin of 50 percentage points or more. (And the “partisan gap holds even after accounting for income, race and age demographics, population density and a county’s infection and death rate.”) The gap continued to widen in July.
Controlling for the poverty rate and other relevant variables (particularly age and temperature), we have found that a 1 percentage-point increase in a county’s residents over 12 years old who were fully vaccinated as of June 9th is associated with a covid-19 death rate during the subsequent 30 days (to July 9th ) that was lower by .05 per 100,000 inhabitants. So, controlling for poverty and the other variables lowered the estimated coefficient slightly, but not significantly so.
But even with the controls, the estimate is biased if the vaccination decision is influenced by covid-19 prevalence, as noted. Using variation in the vaccination decision attributable solely to Trump-affinity, we have found that a 1 percentage-point increase in a county’s vaccination rate as of June 9th reduced the covid-19 death rate during the subsequent 30 days (to July 9th) by .04 per 100,000 inhabitants, controlling for the poverty rate and other variables.
As the CDC director said recently, “this is becoming a pandemic of the unvaccinated.” More than 99 percent of covid-19 deaths are now occurring among those who have not gotten the vaccine.
The reason for looking at the role of voting patterns was to improve the county-based estimate of vaccine effectiveness on anyone, regardless of the political party. But perhaps some of the skeptics will notice a higher casualty rate among their group and will change their minds. One can hope.
* * *
A shorter version of this commentary appeared at Project Syndicate. Comments can be posted there or at Econbrowser. The underlying econometrics are spelled out in “The Virus, Vaccination, and Voting: An Econometric Analysis.” I am grateful for the excellent research assistance of Randy Kotti.